Introduction to Limits
By the end of this session, you will be able to:
- Disentangle limit behavior from function values (the concept of approaching).
- Diagnose and classify why a limit fails to exist (DNE).
- Execute the limiting process to turn average rates into instantaneous rates.
📅 Micro-Lecture
1. Introduction to Limits & Approaching Behavior
- Mathematical Foundation: The study of limits bridges algebra and calculus by shifting focus from exact coordinates to infinitesimally close behavioral trends. We write limx→af(x)=L to denote that f(x) approaches L as x approaches a, but not equal to a.
- Engineering Context: In real-world engineering, limits model fluid dynamics, particle physics near singularities, and aerodynamic transitions like supersonic shockwaves.
2. Limit Failures (DNE) & Discontinuities
- Mathematical Foundation: According to the Existence Theorem for Two-Sided Limits, a two-sided limit exists if and only if both the left-hand and right-hand limits approach the same finite value. If they do not, or if the function grows without bound, or fluctuates infinitely, the limit does not exist (DNE).
- Engineering Context: Classifying discontinuities (Jump, Infinite, and Removable) helps diagnose digital circuit signal instability, shockwave structures, and volatile systems.
3. Average vs. Instantaneous Rates
- Mathematical Foundation: The average rate of change on [a,b] is the slope of the secant line b−af(b)−f(a). The instantaneous rate of change is the limit of the average rates as the interval shrinks, which is the slope of the tangent line: limh→0hf(x0+h)−f(x0).
- Engineering Context: Instantaneous rates drive real-time telemetry, sensor readings, and autonomous vehicle speed estimations.
Skill Block 1
Real-Life Engineering Applications
Signal Cutoff Gain (Electrical & Computer Engineering)
A digital signal processing (DSP) engineer is designing an ideal brick-wall low-pass filter. The normalized voltage gain G(f) of the filter as a function of the signal frequency f (in kHz) is modeled by:
At the cutoff frequency of f=4 kHz, the filter's electronic circuitry experiences a singularity (direct evaluation yields 0/0, making the exact gain value G(4) undefined).
- Explain why direct evaluation at f=4 kHz fails.
- Use a numerical approach to show that as the input frequency approaches the cutoff f=4 kHz from the left (f→4−) and right (f→4+), the gain approaches a stable value. What is this limit?
💡 Show Worked Derivation
Part 1: Why direct evaluation fails
Direct substitution of the target frequency f=4 kHz into the gain equation yields:
Part 2: Numerical evaluation near the cutoff frequency
We simplify the gain equation for all frequencies f=4 kHz by factoring the numerator:
We evaluate the gain at frequencies arbitrarily close to 4 kHz from both below and above:
- Approaching from the left (f→4−):
- G(3.9)=3.9+4=7.9
- G(3.99)=3.99+4=7.99
- G(3.999)=3.999+4=7.999
- Approaching from the right (f→4+):
- G(4.1)=4.1+4=8.1
- G(4.01)=4.01+4=8.01
- G(4.001)=4.001+4=8.001
Summary table of gain values:
| Frequency f (kHz) | 3.9 | 3.99 | 3.999 | 4 | 4.001 | 4.01 | 4.1 |
|---|---|---|---|---|---|---|---|
| Gain G(f) | 7.9 | 7.99 | 7.999 | ? | 8.001 | 8.01 | 8.1 |
Conclusion: As the frequency pinches closer to the cutoff f=4 kHz from both sides, the gain values approach a stable value of exactly 8. Thus, while the gain G(4) is undefined, the limit is well-defined:
Disentangling Limit Behavior from Function Values (The Concept of "Approaching")
General Overview
Skill Block 1 focuses on separating a function's approached path from its actual destination value, using both numerical and graphical approaches.
Conceptual Framework
- Limits look around the target, never at it: Unlike algebra where we look exactly at an input x=c, limits evaluate the trend as x→c (arbitrarily close, but not equal).
- Multi-Representational Strategy: Approaching behavior can be evaluated arithmetically (building a table of sandwiching inputs) and visually (tracing fingers inward along the curve from the left and right).
- Indeterminate Hole: The form 00 indicates the function value itself is undefined (a removable discontinuity / hole), but the limit can still exist if the neighboring path remains predictable.
Key Equations & Structural Rules
- Existence Theorem: limx→af(x)=L⟺limx→a−f(x)=L and limx→a+f(x)=L.
- Simplification Rule: If f(x)=x−ax2−a2, then f(x)=x+a for x=a.
Worked Example A: Numerical Evaluation (The Estimation Table)
Complete the table for f(x)=x−3x2−9 to find limx→3f(x).
💡 Reveal Worked Solution
- Left-Hand Trend (x→3−): Plug values slightly less than 3 into the simplified path rule f(x)=x+3:
- f(2.9)=2.9+3=5.9
- f(2.99)=2.99+3=5.99
- f(2.999)=2.999+3=5.999
- Right-Hand Trend (x→3+): Plug values slightly greater than 3 into the path rule:
- f(3.1)=3.1+3=6.1
- f(3.01)=3.01+3=6.01
- f(3.001)=3.001+3=6.001
- Analyze Convergence: Assemble the table:
| x approaches from left → | 2.9 | 2.99 | 2.999 | 3 | 3.001 | 3.01 | 3.1 | ← x approaches from right |
|---|---|---|---|---|---|---|---|---|
| f(x) trend | 5.9 | 5.99 | 5.999 | ? | 6.001 | 6.01 | 6.1 |
As x pinches closer to 3 from both sides, the output values head toward the distinct value 6. Therefore, the limit is:
Worked Example B: Graphical Evaluation (Holes vs. Solid Dots)
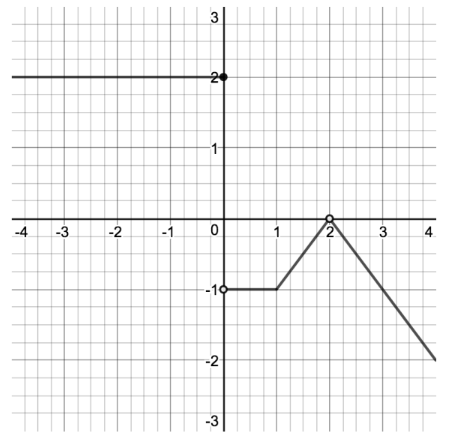
Use the piecewise graph provided below to evaluate the exact function value f(−1) and the limit value limx→−1f(x).
💡 Reveal Worked Solution
- Determine the Function Value f(−1): Look precisely along the vertical grid line x=−1. There is an open circle at a height of 2 and a solid dot at a height of 1. The solid dot represents the actual function value, so f(−1)=1.
- Determine the Limit limx→−1f(x): Trace along the lines of the graph as you approach x=−1 from both the left and right. Both paths lead directly to the open circle at height y=2, so limx→−1f(x)=2.
- Compare Results: Note that limx→−1f(x)=f(−1) since 2=1. This proves that a limit depends entirely on the expected trajectory of the path, independent of the actual point plotted at the destination.
Practice Problem 1: Concept & Reading Check
Open this Skill Block on the Memex to locate the information needed to answer the following:
- (a) Under the Conceptual Framework section, what does the statement "limits look around the target, never at it" mean? How does it differ from algebra?
- (b) According to Worked Example B, if the limit as x→−1 is 2, why is the function value f(−1) equal to 1?
- (c) Review the linked Engineering Application under the Engineering Applications section. How does limit behavior apply to electrical/computer engineering signal gain?
Read the Conceptual Framework section, look at the solution to Worked Example B, and review the context in the Engineering Applications section under "Signal Cutoff Gain".
Answer: * (a) Algebra evaluates exactly at x=c. Limits describe the expected output value as we get arbitrarily close to x=c from both sides, even if the function is undefined there.
- (b) The limit represents the approached path (which targets the open circle at height 2), while the function value is the actual destination point (represented by the solid dot at height 1).
- (c) Limits model sudden state transitions, such as evaluating signal gain values near a threshold where the regular formula is undefined or hits a cutoff.
Step-by-Step Execution
- (a) According to the Conceptual Framework section, algebra deals with exact coordinates at x=c, whereas limits describe the trend of outputs as we approach the input c from neighboring values.
- (b) In Worked Example B, tracing the graph from both sides of x=−1 leads to the open circle at y=2, which gives the limit. The solid dot at (−1,1) represents the isolated function value, showing that path behavior (limit) can differ from the exact coordinate.
- (c) As outlined in the Engineering Applications section under "Signal Cutoff Gain", limits allow electrical engineers to compute signal stability and gain near mathematical singularities (like division by zero at boundary cutoffs) by examining approaching trends.
Practice Problem 2
Complete the table given below for f(x)=x−2x2−4, then evaluate the given limits:
| x | 1.9 | 1.99 | 1.999 | 2.001 | 2.01 | 2.1 |
|---|---|---|---|---|---|---|
| f(x) |
(a) limx→2−x−2x2−4 (b) limx→2+x−2x2−4 (c) limx→2x−2x2−4 (d) Why can't we just find f(2) to determine limx→2f(x)?
For any value of x=2, simplify the function by factoring the numerator as a difference of squares: x−2x2−4=x−2(x−2)(x+2)=x+2. Evaluate the table using x+2. For (d), consider that f(2) results in 00, which is undefined, whereas a limit checks the values near x=2.
Answer: - Table: 3.9, 3.99, 3.999, 4.001, 4.01, 4.1
- (a) 4
- (b) 4
- (c) 4
- (d) Direct evaluation gives an undefined indeterminate form 00, but the limit describes approaching behavior and equals 4.
Step-by-Step Execution
- Simplify the Function: Factor the numerator:
f(x)=x−2(x−2)(x+2)=x+2(for x=2)
- Evaluate the Table:
- f(1.9)=1.9+2=3.9
- f(1.99)=1.99+2=3.99
- f(1.999)=1.999+2=3.999
- f(2.001)=2.001+2=4.001
- f(2.01)=2.01+2=4.01
- f(2.1)=2.1+2=4.1
- Evaluate the Limits:
- (a) As x→2−, f(x) approaches 4.
- (b) As x→2+, f(x) approaches 4.
- (c) Since the left-hand and right-hand limits match, the two-sided limit exists and is equal to 4.
- (d) Direct substitution of x=2 gives f(2)=00, which is undefined. The limit describes what height the function approaches as we get closer to x=2 from the sides, which is 4.
Practice Problem 3
For the graph of f(x) given below, find the following values, if they exist. If it does not exist, state "DNE".
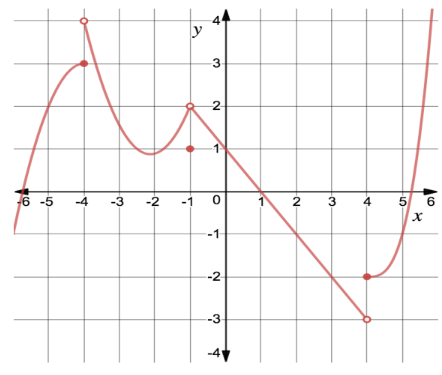
| (a) f(−1) | (d) limx→4+f(x) | (g) limx→−4−f(x) |
| (b) limx→−1f(x) | (e) limx→4−f(x) | (h) limx→−4f(x) |
| (c) f(4) | (f) limx→4f(x) | (i) limx→−5f(x) |
- Function Values f(c): Find the y-coordinate of the solid dot exactly at x=c. If only an open circle exists, the function value is undefined.
- One-Sided Limits: Trace the graph from the left (c−) or right (c+) toward x=c.
- Two-Sided Limits: The limit exists if the left-hand and right-hand limits approach the same y-value.
Answer: - (a) 1
- (b) 2
- (c) −2
- (d) −2
- (e) −3
- (f) DNE
- (g) 3
- (h) DNE
- (i) 2
Step-by-Step Execution
- Part (a) - f(−1): At x=−1, there is an open circle at y=2 and a solid dot at y=1. The solid dot represents the function value, so f(−1)=1.
- Part (b) - limx→−1f(x): Approaching x=−1 from both sides, the curve targets the open circle at height y=2. Thus, the limit is 2.
- Part (c) - f(4): Looking at x=4, there is a solid dot at y=−2 and an open circle at y=−3. Therefore, f(4)=−2.
- Part (d) - limx→4+f(x): Tracing the curve from the right toward x=4, the curve approaches the solid dot at height y=−2.
- Part (e) - limx→4−f(x): Tracing the line from the left toward x=4, the line leads to the open circle at height y=−3.
- Part (f) - limx→4f(x): Since the left-hand limit (−3) and right-hand limit (−2) do not match, the two-sided limit does not exist (DNE).
- Part (g) - limx→−4−f(x): Tracing from the left toward x=−4, the curve ends at the solid dot at height y=3.
- Part (h) - limx→−4f(x): Tracing from the right toward x=−4, the curve approaches the open circle at y=4. Since the left-hand limit (3) and right-hand limit (4) do not match, the two-sided limit is DNE.
- Part (i) - limx→−5f(x): The curve is continuous and smooth at x=−5, passing exactly through height y=2 from both directions, so the limit is 2.
📅 Regroup 1
- Discuss why a limit can exist at a hole where the function value is undefined or different.
- Address the notation difference: f(a) represents the y-value at x=a, whereas limx→af(x) represents the y-value approached by the path as x gets close to a.
Skill Block 2
Real-Life Engineering Applications
Boundary Failure Classification (Aerospace & Civil Engineering)
A structural systems engineer is analyzing three different stress, pressure, and electrical simulation scenarios near critical system boundaries, modeled by the functions below:
- Shockwave Boundary (Aerospace/Mechanical): The localized gas pressure P(x) (in atmospheres) near a supersonic nozzle shock boundary at x=0 is modeled by:
P(x)=x∣x∣Evaluate the limit limx→0P(x).
- Stress Singularity (Civil/Structural): The mechanical stress σ(x) (in MPa) in a steel girder near a micro-crack singularity at x=2 mm is modeled by:
σ(x)=(x−2)25Evaluate the limit limx→2σ(x).
- Signal Chatter (Electrical/Instrumentation): A sensor's signal voltage response V(t) (in mV) under high-frequency electrical interference near t=0 seconds is modeled by:
V(t)=sin(t1)Evaluate the limit limt→0V(t).
For each scenario, determine if the limit exists. If the limit does not exist (DNE), classify the failure using one of the three structural behaviors (Jump Discontinuity, Unbounded Behavior, or Wildly Oscillating Behavior) and state the engineering implications.
💡 Show Worked Derivation
1. Shockwave Boundary (Aerospace/Mechanical)
- Calculation:
- As x→0−, the input x is negative, so ∣x∣=−x, giving P(x)=x−x=−1.
x→0−limP(x)=−1
- As x→0+, the input x is positive, so ∣x∣=x, giving P(x)=xx=1.
x→0+limP(x)=1
- Since −1=1, the left-hand and right-hand limits do not match.
- As x→0−, the input x is negative, so ∣x∣=−x, giving P(x)=x−x=−1.
- Classification: DNE (Jump Discontinuity).
- Engineering Implication: A jump discontinuity models a physical shockwave transition (such as a sudden pressure jump as a vehicle goes supersonic), where the system state changes abruptly, creating localized structural loads.
2. Stress Singularity (Civil/Structural)
- Calculation:
- As x approaches 2 from either direction (x→2− or x→2+), the term (x−2)2 is positive and gets extremely close to 0.
- The constant numerator is positive (5), so dividing 5 by a tiny positive decimal drives the stress values infinitely high:
x→2−lim(x−2)25=+∞andx→2+lim(x−2)25=+∞
- Classification: DNE (Unbounded Behavior / Vertical Asymptote).
- Engineering Implication: Unbounded stress models a sharp crack stress singularity, warning the civil engineer that theoretical stresses go to infinity, which physically triggers material yield, yielding, or total structural failure unless the crack tip is rounded off.
3. Signal Chatter (Electrical/Instrumentation)
- Calculation:
- As t→0, the angle θ=t1 approaches ±∞.
- As the angle goes to infinity, the sine function oscillates rapidly between −1 and 1, never settling on a single real value.
- Classification: DNE (Wildly Oscillating Behavior).
- Engineering Implication: Wild oscillation models severe electrical interference or contact chatter, where the sensor readings oscillate so rapidly that the controller cannot extract a clean signal, indicating a need for a hardware low-pass filter.
Diagnosing and Classifying Why a Limit Fails to Exist (DNE)
General Overview
Skill Block 2 establishes core proficiency in diagnosing why a two-sided limit fails to exist, classifying the failure into one of three structural types of discontinuities: Jump Discontinuity, Infinite Discontinuity (Unbounded Behavior), or Wildly Oscillating Behavior.
Conceptual Framework
- Directional Path Agreement & Existence Theorem: By the Existence Theorem for Two-Sided Limits, a two-sided limit exists if and only if both the left-hand and right-hand limits exist and are equal (limx→a−f(x)=limx→a+f(x)=L). If they disagree, the limit fails.
- Jump Discontinuity: Occurs when both one-sided limits are finite numbers but do not equal each other. The graph exhibits a physical gap or step.
- Infinite Discontinuity (Unbounded Behavior): Occurs when the function values shoot to +∞ or −∞ as the input approaches the target, indicating a vertical asymptote.
- Wildly Oscillating Behavior: Occurs when the function values fluctuate infinitely fast between multiple values near the target, preventing convergence.
Key Equations & Structural Rules
- Existence Theorem: limx→af(x)=L⟺limx→a−f(x)=L=limx→a+f(x)
- Jump Discontinuity Condition: limx→a−f(x)=limx→a+f(x) (both finite)
- Vertical Asymptote / Infinite Discontinuity Condition: limx→af(x)=±∞
Worked Example A: Analyzing a Jump Discontinuity
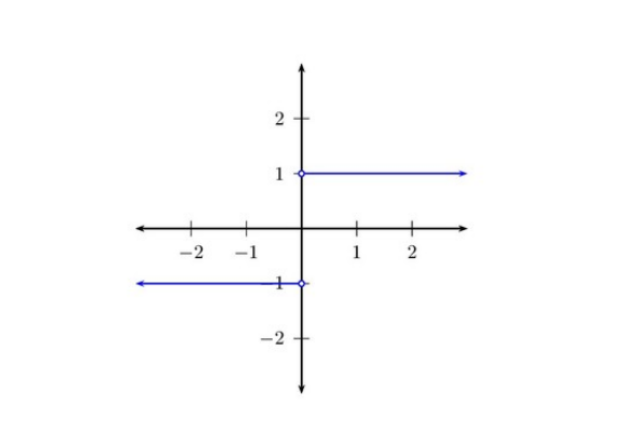
Analyze the function f(x)=x∣x∣ near x=0 using the graph below to evaluate the one-sided limits and the two-sided limit.
💡 Reveal Worked Solution
- Evaluate Left-Hand Limit: Trace the graph from the left toward x=0 (x<0). The function forms a flat line at a height of −1:
x→0−limx∣x∣=−1
- Evaluate Right-Hand Limit: Trace the graph from the right toward x=0 (x>0). The function forms a flat line at a height of 1:
x→0+limx∣x∣=1
- Determine Two-Sided Limit: Because the left-hand and right-hand limits do not match (−1=1), by the Existence Theorem, the two-sided limit does not exist:
x→0limx∣x∣=DNE(Classification: Jump Discontinuity)
Worked Example B: Analyzing Unbounded Behavior
Evaluate limx→0x21 numerically and graphically.
💡 Reveal Worked Solution
- Numerical Evaluation: Pick values that approach 0 from both sides:
- f(±0.1)=(0.1)21=100
- f(±0.01)=(0.01)21=10,000
- f(±0.001)=(0.001)21=1,000,000
- Analyze Trend: As inputs get closer to 0, the output values grow without bound toward positive infinity.
- Conclude: Graphically, both sides of the curve shoot straight up along the vertical asymptote x=0. Since the values do not approach a single real number, the limit does not exist:
x→0limx21=DNE(or +∞)(Reason: Unbounded Behavior)
Worked Example C: Analyzing Wildly Oscillating Behavior
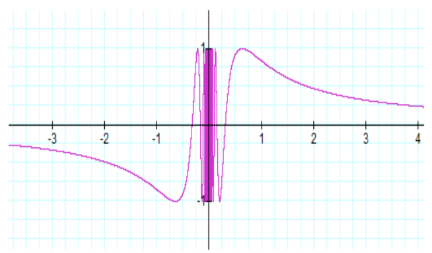
Determine why limx→0sin(x1) fails to exist using the tracking data.
💡 Reveal Worked Solution
- Analyze Data points as x→0+:
- At x=0.01⟹f(x)=sin(100)≈−0.5064
- At x=0.001⟹f(x)=sin(1000)≈0.8269
- At x=0.0001⟹f(x)=sin(10000)≈−0.3056
- At x=0.00001⟹f(x)=sin(100000)≈0.0357
- Analyze Trend: As x approaches 0, the function value fluctuates rapidly and infinitely between −1 and 1. It never settles down or stabilizes near a single number.
- Conclude:
x→0limsin(x1)=DNE(Reason: Wildly Oscillating Behavior)
Practice Problem 4: Concept & Reading Check
Open this Skill Block on the Memex to locate the information needed to answer the following:
- (a) Under the Conceptual Framework section, list the three structural types of limit failures (DNE) covered in this block.
- (b) Look at Worked Example A. Why does the two-sided limit limx→0x∣x∣ fail to exist? Detail the left-hand and right-hand values.
- (c) In Worked Example C, why does the function values table show that limx→0sin(1/x) does not exist? What behavior does it exhibit?
Refer to the Conceptual Framework and the solutions in Worked Examples A and C of this Skill Block on the Memex.
Answer: * (a) Jump Discontinuity, Unbounded Behavior, and Wildly Oscillating Behavior.
- (b) The left-hand limit is −1 and the right-hand limit is 1. Because they do not match, the two-sided limit fails to exist (DNE).
- (c) The function values fluctuate infinitely and rapidly between −1 and 1 as x approaches 0, never settling near a single value.
Step-by-Step Execution
- (a) The Conceptual Framework section lists three reasons a limit fails to exist:
- Jump Discontinuity: One-sided limits exist and are finite but differ.
- Unbounded Behavior: The function grows to positive or negative infinity (vertical asymptote).
- Wildly Oscillating Behavior: The function fluctuates endlessly between different values without converging.
- (b) In Worked Example A, tracing the graph of f(x)=x∣x∣ near x=0 yields a left-hand limit of −1 and a right-hand limit of 1. Since the left and right trajectories approach different values, the two-sided limit does not exist (a Jump Discontinuity).
- (c) Tracing the data in Worked Example C shows that as x→0, the function values fluctuate back and forth between −1 and 1 (e.g. going from −0.5064→0.8269→−0.3056). The function never stabilizes or converges to a single coordinate, which is classified as Wildly Oscillating Behavior.
Practice Problem 5
Evaluate the limit analytically or graphically. If the limit does not exist, classify the failure using one of the three structural behaviors (Jump Discontinuity, Unbounded Behavior, or Wildly Oscillating Behavior):
Calculate the left-hand limit using 2x−1 as x→3− and the right-hand limit using 10−x as x→3+. Compare whether the two directional limits agree.
Answer: DNE (Jump Discontinuity)
Step-by-Step Execution
- Left-hand limit: limx→3−f(x)=limx→3−(2x−1)=2(3)−1=5
- Right-hand limit: limx→3+f(x)=limx→3+(10−x)=10−3=7
- Since 5=7, the two-sided limit fails to exist. Because both one-sided limits are finite numbers that do not match, this failure is classified as a Jump Discontinuity.
Practice Problem 6
Evaluate the limit analytically. If the limit does not exist, classify the failure using one of the three structural behaviors (Jump Discontinuity, Unbounded Behavior, or Wildly Oscillating Behavior):
Analyze the behavior of the denominator (x−2) as x→2− (approaching through negative values) and x→2+ (approaching through positive values).
Answer: DNE (Unbounded Behavior)
Step-by-Step Execution
- As x→2−, the denominator x−2 is negative and approaches 0, so x−23→−∞.
- As x→2+, the denominator x−2 is positive and approaches 0, so x−23→+∞.
- Because the function values grow infinitely large (in absolute value) and do not approach a finite real number as x→2, the limit is DNE due to Unbounded Behavior (a vertical asymptote at x=2).
Practice Problem 7
Evaluate the limit analytically. If the limit does not exist, classify the failure using one of the three structural behaviors (Jump Discontinuity, Unbounded Behavior, or Wildly Oscillating Behavior):
Consider how the angle θ=xπ behaves as x→0+, and what that infinite growth does to the oscillating values of the cosine function.
Answer: DNE (Wildly Oscillating Behavior)
Step-by-Step Execution
- As x→0+, the angle θ=xπ approaches +∞.
- The cosine function cos(θ) oscillates continuously between −1 and 1. As x gets closer to 0, these oscillations happen infinitely fast. For example:
- x=1⟹cos(π)=−1
- x=0.5⟹cos(2π)=1
- x=0.25⟹cos(4π)=1
- x=2/3⟹cos(1.5π)=0
- The function values do not stabilize or settle near any single number. Thus, the limit is DNE due to Wildly Oscillating Behavior.
📅 Regroup 2
- Discuss how physical systems exhibit these failures: a switch flipping represents a jump discontinuity; a capacitor charging rate near a singularity can model unbounded behavior; and noise/chatter in a signal can model oscillating behavior.
Skill Block 3
Real-Life Engineering Applications
Discrete Network Telemetry (Computer & Systems Engineering)
A network systems engineer is monitoring the cumulative data transferred, D (in Gigabytes), over a cloud server during a traffic spike. A network interface controller samples the total data transferred at discrete times t (in seconds), summarized in the table below:
| Time t (seconds) | Cumulative Data D(t) (GB) |
|---|---|
| 10 | 150.00 |
| 12 | 206.00 |
| 14 | 274.00 |
| 15 | 312.50 |
- Calculate the average data transfer rate (in GB/s) over the intervals [10,14] and [12,14] using the discrete data from the table.
- If the data transfer profile is modeled continuously by D(t)=1.5t2−5t+50, use the secant slope limiting process over the shrinking intervals [14,14.1], [14,14.01], and [14,14.001] to estimate the instantaneous data transfer rate (throughput) at exactly t=14 seconds.
💡 Show Worked Derivation
Part 1: Calculate average data transfer rates from the table
- For the interval [10,14]:
Average Rate=14−10D(14)−D(10)=4274.00−150.00=4124.00=31 GB/s
- For the interval [12,14]:
Average Rate=14−12D(14)−D(12)=2274.00−206.00=268.00=34 GB/s
Part 2: Shrinking intervals using continuous model D(t)=1.5t2−5t+50
The baseline value at the fixed starting point t=14 is:
- Interval [14,14.1]:
- Evaluate at t=14.1:
D(14.1)=1.5(14.1)2−5(14.1)+50=1.5(198.81)−70.5+50=277.715 GB
- Calculate average rate:
Average Rate=14.1−14277.715−274.00=0.13.715=37.15 GB/s
- Evaluate at t=14.1:
- Interval [14,14.01]:
- Evaluate at t=14.01:
D(14.01)=1.5(14.01)2−5(14.01)+50=1.5(196.2801)−70.05+50=274.37015 GB
- Calculate average rate:
Average Rate=14.01−14274.37015−274.00=0.010.37015=37.015 GB/s
- Evaluate at t=14.01:
- Interval [14,14.001]:
- Evaluate at t=14.001:
D(14.001)=1.5(14.0012)−5(14.001)+50=1.5(196.028001)−70.005+50=274.0370015 GB
- Calculate average rate:
Average Rate=14.001−14274.0370015−274.00=0.0010.0370015=37.0015 GB/s
- Evaluate at t=14.001:
Conclusion (Limit Inference): As the interval length Δt approaches 0, the average data transfer rates (37.15→37.015→37.0015) converge to exactly 37 GB/s. This represents the estimated instantaneous data transfer rate (throughput) at t=14 seconds.
Executing the "Limiting Process" to Turn Average Rates into Instantaneous Rates
General Overview
Skill Block 3 bridges algebra and differential calculus by taking average rates calculated over shrinking intervals and showing how they converge to a unique value, representing the instantaneous rate.
Conceptual Framework
- Secant vs. Tangent Lines: The average rate of change represents the slope of a secant line between two distinct points on a curve. The instantaneous rate of change represents the slope of the tangent line at a single point.
- The h→0 Limit: We cannot compute instantaneous rate by setting interval length h=0 because we get 00. We must evaluate the limit of the secant slopes as h approaches 0.
- Moving Point Analysis: Tracing a secant line as the second point Q slides along the curve toward the fixed point P shows how the secant slope rotates and aligns with the tangent line.
Key Equations & Structural Rules
- Average Rate of Change: Average Rate=x2−x1f(x2)−f(x1)
- Instantaneous Rate of Change: Instantaneous Rate=limh→0hf(x0+h)−f(x0)
Worked Example A: Calculating Average Rate of Change
Find the average rate of change of f(x)=sin(x) over the interval [0,6π].
💡 Reveal Worked Solution
- Evaluate Function at Endpoints:
- f(0)=sin(0)=0
- f(6π)=sin(6π)=0.5=21
- Apply Formula:
Average Rate=π/6−0f(π/6)−f(0)=π/60.5−0=π/60.5=π3≈0.9549The average rate of change is π3≈0.9549.
Worked Example B: The Shifting Interval Process (Kinematics)
A rock is launched vertically upward from the ground with an initial speed of 85 ft/sec. Its position equation is modeled by s(t)=−16t2+85t. Use a sequence of shrinking intervals to estimate the instantaneous velocity of the rock at exactly t=1 second.
💡 Reveal Worked Solution
- Find s(1):
s(1)=−16(1)2+85(1)=69 ft
- Calculate Average Velocity over broad interval [1,2]:
- s(2)=−16(2)2+85(2)=106 ft
- Average Velocity=2−1s(2)−s(1)=1106−69=37 ft/sec
- Shrink interval to [1,1.1]:
- s(1.1)=−16(1.1)2+85(1.1)=74.14 ft
- Average Velocity=1.1−174.14−69=0.15.14=51.4 ft/sec
- Shrink interval to [1,1.01]:
- s(1.01)=−16(1.01)2+85(1.01)=69.5284 ft
- Average Velocity=1.01−169.5284−69=0.010.5284=52.84 ft/sec
- Shrink interval to [1,1.001]:
- s(1.001)=−16(1.001)2+85(1.001)=69.052984 ft
- Average Velocity=1.001−169.052984−69=0.0010.052984=52.984 ft/sec
- Infer the Limit: As the time interval length approaches 0, the average velocities (37→51.4→52.84→52.984) converge toward 53 ft/sec. This is the estimated instantaneous velocity at t=1.
Practice Problem 8: Concept & Reading Check
Open this Skill Block on the Memex to locate the information needed to answer the following:
- (a) Under the Conceptual Framework section, what geometric slopes do the secant line and tangent line represent?
- (b) Explain why we cannot compute the instantaneous rate of change by simply setting the interval length h=0 in the formula. What mathematical form does it produce?
- (c) Trace Worked Example B. What sequence of average velocities was calculated, and what value did they converge to?
Refer to the Conceptual Framework (under Secant vs. Tangent lines and the h→0 limit) and the solution to Worked Example B in this Skill Block on the Memex.
Answer: * (a) The secant line slope represents the average rate of change. The tangent line slope represents the instantaneous rate of change.
- (b) Setting h=0 directly produces the indeterminate form 00, which is algebraically undefined. We must evaluate the limit as h approaches 0 instead.
- (c) Average velocities: 37→51.4→52.84→52.984 ft/sec. They converge to 53 ft/sec.
Step-by-Step Execution
- (a) According to the Conceptual Framework section, the average rate of change corresponds to the slope of a secant line between two distinct points. The instantaneous rate of change corresponds to the slope of a tangent line at a single point.
- (b) As explained in the Conceptual Framework, substituting h=0 directly into the rate expression yields 0f(x0)−f(x0)=00, which is undefined. We must use the limiting process (h→0) to evaluate the approaching behavior.
- (c) Tracing the solution in Worked Example B, the sequence of average velocities calculated over shrinking intervals is:
- [1,2]⟹37 ft/sec
- [1,1.1]⟹51.4 ft/sec
- [1,1.01]⟹52.84 ft/sec
- [1,1.001]⟹52.984 ft/sec These values converge to 53 ft/sec as the time interval approaches 0.
Practice Problem 9
Find the average rate of change of the polynomial function over the given interval:
Evaluate the function at the endpoints x=−1 and x=2, then apply the average rate of change formula: 2−(−1)f(2)−f(−1).
Answer: 0
Step-by-Step Execution
- Evaluate at x=2:
f(2)=3(2)2−3(2)+5=12−6+5=11
- Evaluate at x=−1:
f(−1)=3(−1)2−3(−1)+5=3+3+5=11
- Compute the average rate of change:
Average Rate=2−(−1)f(2)−f(−1)=311−11=0
Practice Problem 10
Find the average rate of change of the trigonometric function over the given interval:
Evaluate g(t) at the endpoints t=0 and t=6π. Note that cos(π/6)=23, so cos2(π/6)=43. Then apply π/6−0g(π/6)−g(0).
Answer: −2π9≈−1.4324
Step-by-Step Execution
- Evaluate at t=6π:
g(6π)=3[cos(6π)]2=3(23)2=3(43)=49
- Evaluate at t=0:
g(0)=3[cos(0)]2=3(1)2=3
- Compute the average rate of change:
Average Rate=π/6−0g(π/6)−g(0)=6π49−3=6π−43=−43⋅π6=−4π18=−2π9≈−1.4324
Practice Problem 11
If a rock is thrown upward on the planet Mars with a velocity of 20 m/s, its height in meters t seconds later is given by s(t)=20t−2t2.
(a) Find the average velocity of the rock over the given time intervals:
- i. [1,1.1]
- ii. [1,1.01]
- iii. [1,1.001]
- iv. [1,1.0001] (b) Estimate the instantaneous velocity when t=1.
Calculate the initial position s(1)=18. For each interval [1,b], find the position at b using s(b)=20b−2b2, then apply b−1s(b)−s(1). Look at the values as b approaches 1.
Answer: - (a) i. 15.8 m/s, ii. 15.98 m/s, iii. 15.998 m/s, iv. 15.9998 m/s
- (b) 16 m/s
Step-by-Step Execution
- Find Initial Value:
s(1)=20(1)−2(1)2=18 m
- Compute Average Velocities:
- i. Interval [1,1.1]:
- s(1.1)=20(1.1)−2(1.21)=22−2.42=19.58 m
- Average Velocity=1.1−119.58−18=0.11.58=15.8 m/s
- ii. Interval [1,1.01]:
- s(1.01)=20(1.01)−2(1.01)2=20.2−2.0402=18.1598 m
- Average Velocity=1.01−118.1598−18=0.010.1598=15.98 m/s
- iii. Interval [1,1.001]:
- s(1.001)=20(1.001)−2(1.001)2=20.02−2.004002=18.015998 m
- Average Velocity=1.001−118.015998−18=0.0010.015998=15.998 m/s
- iv. Interval [1,1.0001]:
- s(1.0001)=20(1.0001)−2(1.0001)2=20.002−2.00040002=18.00159998 m
- Average Velocity=1.0001−118.00159998−18=0.00010.00159998=15.9998 m/s
- i. Interval [1,1.1]:
- Estimate Instantaneous Velocity:
Looking at the sequence of average velocities:
15.8→15.98→15.998→15.9998As the time interval length approaches zero, the values converge to 16 m/s.
📅 Regroup 3
- Discuss how a physical instantaneous velocity can be measured (such as radar speedometer approximating by taking very short time intervals).
📅 Synthesis Wrap-up
- Core takeaways from Session 02:
- Limits describe paths, functions describe coordinates. They do not have to match.
- Limits DNE when directional paths disagree (Jump), shoot to infinity (Asymptote), or fluctuate endlessly (Oscillation).
- Average rates (secant line slopes) over shrinking intervals converge to the instantaneous rate (tangent line slope) via a limiting process.
- Connections to Knewton Alta Homework: Introduction to Limits.